Paired-end Interaction Tracks
Paul Shannon
2022-08-05
v04.pairedEnd.RmdOverview
With the popularity and wide availability of Hi-C data - a high throughput chromatin confirmation capture technology - an appropriate display format was needed. The igv.js team created the Interact track, supporint the bedpe data file format.
Example
We demonstrate this track with a few lines extracted from the Encode project’s ENCFF110BUX experiment, from Michael Snyder’s lab, showing the boundaries and extent of two topologically-associated domains (TADS), typically small genomic regions which are somewhat isolated from neighboring regions, which is believed to play a role in restricting enhancer/promoter interactions.
An equally important, and perhaps more common use of paired-end interaction data is to represent Hi-C maps of enhancer-promoter interactions. These data also rely upon the bedpe file format.
igv.js provides several visualization parameters not yet supported in igvR.
To define a TAD, two genomic locations are required, as shown here and in the code below:
      chrom1    start1      end1 chrom2    start2      end2
           2 105780000 105790000      2 105890000 105900000
           2 105575000 105600000      2 106075000 106100000
Code
These few lines provide a complete, if minimal introduction to the BedpeInteractionsTrack.
library(igvR)
igv <- igvR()
setBrowserWindowTitle(igv, "Paired-end demo")
setGenome(igv, "hg38")
tbl.bedpe <- data.frame(chrom1=c("2","2"),
                        start1=c(105780000, 105575000),
                        end1=c(105790000, 105600000),
                        chrom2=c("2","2"),
                        start2=c(105890000, 106075000),
                        end2=c(105900000, 106100000),
                        stringsAsFactors=FALSE)

  # construct a "region of interest" (roi) string from tbl.bedpe
  # this is where our two features are found.

shoulder <- 300000
roi <- sprintf("%s:%d-%d", tbl.bedpe$chrom1[1],
                           min(tbl.bedpe$start1) - shoulder,
                           max(tbl.bedpe$end2) + shoulder)

showGenomicRegion(igv, roi)
track <- BedpeInteractionsTrack("ENCFF110BUX", tbl.bedpe)
displayTrack(igv, track)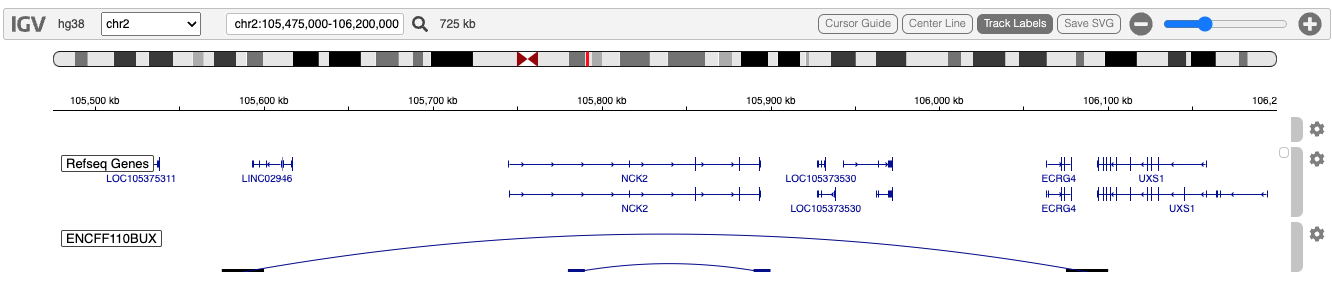
Session Info
sessionInfo()
#> R version 4.2.0 (2022-04-22)
#> Platform: x86_64-apple-darwin17.0 (64-bit)
#> Running under: macOS Big Sur/Monterey 10.16
#>
#> Matrix products: default
#> BLAS:   /Library/Frameworks/R.framework/Versions/4.2/Resources/lib/libRblas.0.dylib
#> LAPACK: /Library/Frameworks/R.framework/Versions/4.2/Resources/lib/libRlapack.dylib
#>
#> locale:
#> [1] en_US.UTF-8/en_US.UTF-8/en_US.UTF-8/C/en_US.UTF-8/en_US.UTF-8
#>
#> attached base packages:
#> [1] stats     graphics  grDevices utils     datasets  methods   base
#>
#> other attached packages:
#> [1] BiocStyle_2.25.0
#>
#> loaded via a namespace (and not attached):
#>  [1] knitr_1.39          magrittr_2.0.3      R6_2.5.1            ragg_1.2.2          rlang_1.0.4
#>  [6] fastmap_1.1.0       highr_0.9           stringr_1.4.0       tools_4.2.0         xfun_0.31
#> [11] cli_3.3.0           jquerylib_0.1.4     systemfonts_1.0.4   htmltools_0.5.3     yaml_2.3.5
#> [16] digest_0.6.29       rprojroot_2.0.3     pkgdown_2.0.6       bookdown_0.27       textshaping_0.3.6
#> [21] BiocManager_1.30.18 purrr_0.3.4         sass_0.4.2          fs_1.5.2            memoise_2.0.1
#> [26] cachem_1.0.6        evaluate_0.15       rmarkdown_2.14      stringi_1.7.8       compiler_4.2.0
#> [31] bslib_0.4.0         desc_1.4.1          jsonlite_1.8.0