igvR is an R package providing interactive connections to igv.js (the Integrative Genomics Viewer) running in a web browser.
 Paul Shannon is the author of igvR. As far as key support and inspiration are concerned Paul once said: "I am grateful to Jim Robinson, Helga Thorvaldsdóttir, Douglass Turner and colleagues for their fine work in igv.js, and their unfailing responsiveness to all requests and questions."
igvR is based upon the Bioconductor R package BrowserViz - of which it is a subclass. It offers easy interactive visual exploration of genomic data from R, including
- Bed (annotation) and BedGraph (quantitative) tracks can be created out of R data.frames and GenomicRanges objects.
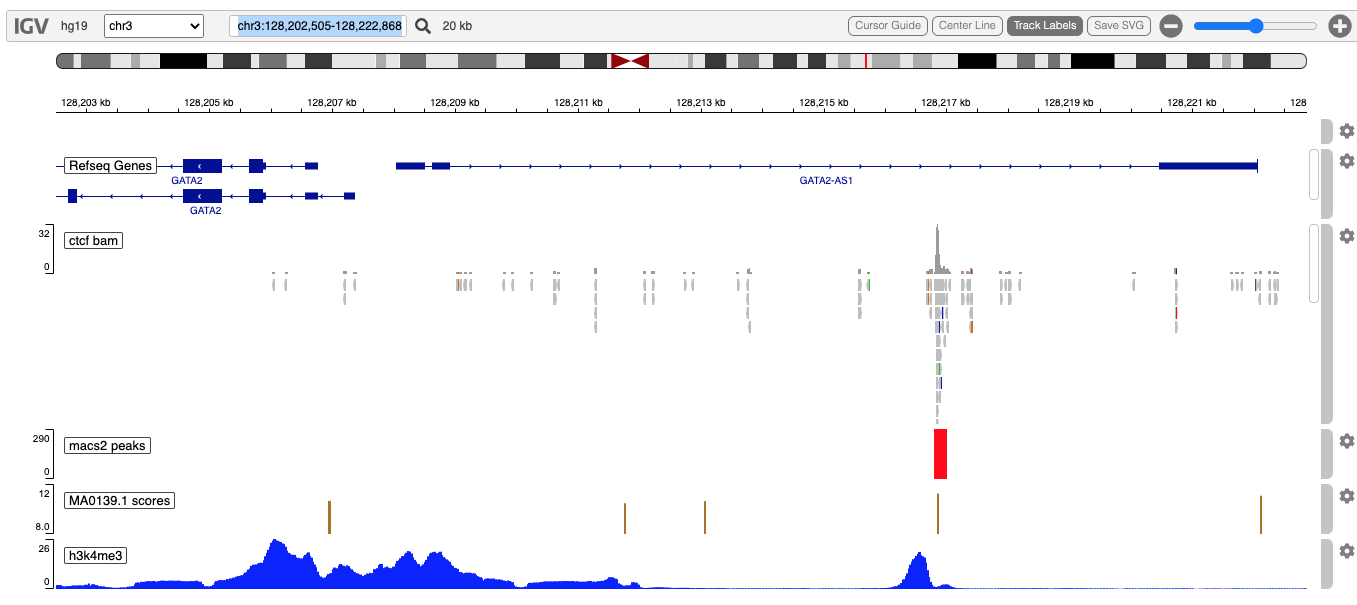
- Aligment data from bam files via GAlignments objects offered by the GenomicAlignments class
- variant data from VCF files via VCF objects offered by the VariantAnnotation class.
- GWAS
- any tabular data with genomic coordinates and a bed-like format
This work is motivated by our belief that contemporary web browsers, supporting HTML5 and Canvas, and running increasingly powerful Javascript libraries (Three.js, d3, igv.js and cytoscape.js) have become the best setting in which to develop interactive graphics for exploratory data analysis.
This package has a first cousin, igvShiny.
RStudio may at some point release a version of Shiny which, when launched, leaves the R console open for interactive commands. When that feature is available, I will merge igvR and igvShiny.
The package is fully documented here, with full function reference and many examples in vignettes (see the Articles menu).