BrowserViz provides the basis for, and a very simple working example of, interactive R/browser visualization. Thus two interactive powerful and complementary environments are linked, creating a powerful hybrid setting for exploratory data analysis.
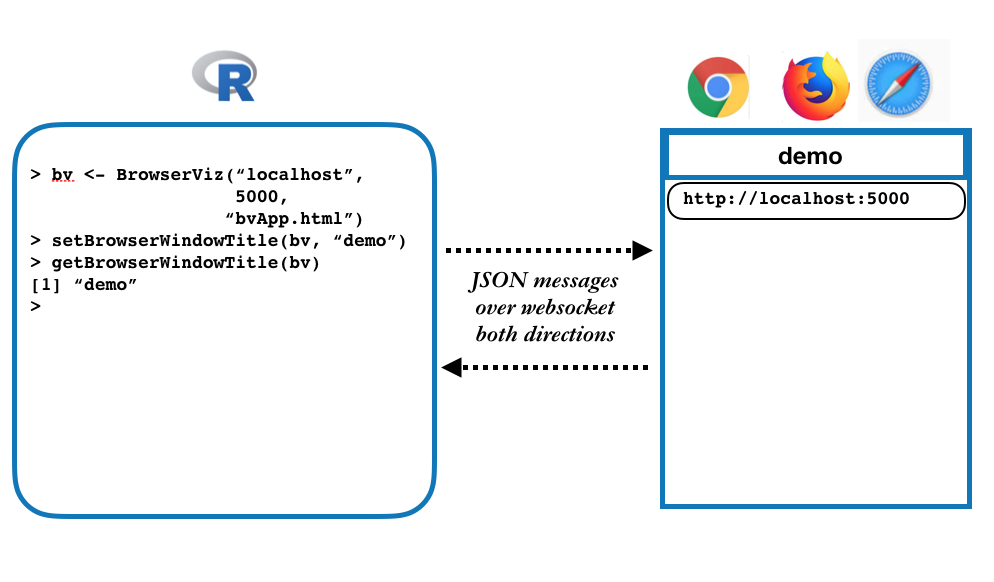
The basic architecture:
This work is motivated by our belief that contemporary web browsers, supporting HTML5 and Canvas, and running increasingly powerful Javascript libraries (for example, d3 and cytoscape.js) have become the best setting in which to develop interactive graphics for exploratory data analysis. We predict that web browsers, already powerful and easily programmed, will steadily improve in rendiring power and interactivity, and thus remain the optimal setting for interactive R visualization for years to come.
BrowserViz is designed as an S4 base class, to be subclassed by other packages. Two examples:
igvR: a Bioconductor package with a high-level interface to the igv.js genome browser
RCyjs: a Bioconductor package for cytoscape.js
Both of these packages are intended for the interactive R user (programmer, script writer, or novice bioinformatician) doing exploratory data analysis, in need of visualzation of their data.
We also offer Shiny widget versions of these two Javascript libraries for those creating point-and-click applications for the non-programming user:
- igvShiny
- cyjShiny
We hope that others will write BrowserViz subclasses bringing other Javascript visualization capability to the R user.
Though BrowserViz is a base class, it is concrete, not abstract - by which I mean that you can create a BrowserViz object that is fully functional, if limited in its capabilities. One of these capabilities is used daily in testing the package. After creating a BrowerViz (“bv”) instance in R with a single line of code, these methods can be called
- setBrowserWindowTitle(bv, “new title”)
- getBrowserWindowTitle(bv)
- getBrowserInfo(bv)
- roundTripTest(bv, someRDataStructure) # e.g., LETTERS, mtcars